How Can We Help?
Reports
By using reports, you can find out what tasks have been done within your desired period? Which project are they related to? Who has done them? How much time has been spent on each task and project? To know them, you can go to the System Reports section and choose one of the below categories:
1) Projects & Tasks Reports
- Projects Progress Report
- User Tasks Report
- Past Due Tasks Report
- User Logins Report
- Delayed Tasks Report
- Audit Log Report
- Entry/Exit Report
- Project Costs Report
2) Time Reports
- Users Timesheets Summary Report
- Projects Timesheets Summary Report
- Users and Projects Timesheets Summary Report
- Timesheets Details
- Timesheets and AttendanceTime Report
- Programs/Contracts Timesheets Summary Report
- Project Daily Planning Report
3) Tailor-made Reports
1) Projects & Activities Reports
Projects Progress Report
Taskbrowse has two kinds of Progress reports: Percent Completed and Planned Percent Completed.
Percent Completed
The Percent Completed of a project will be calculated based on its tasks and their weights in the project. The weight of a task in the project is its Initial Estimated Workload.
Percent Completed of a task is obtained by dividing the time spent on the task by its Initial Estimated Workload.
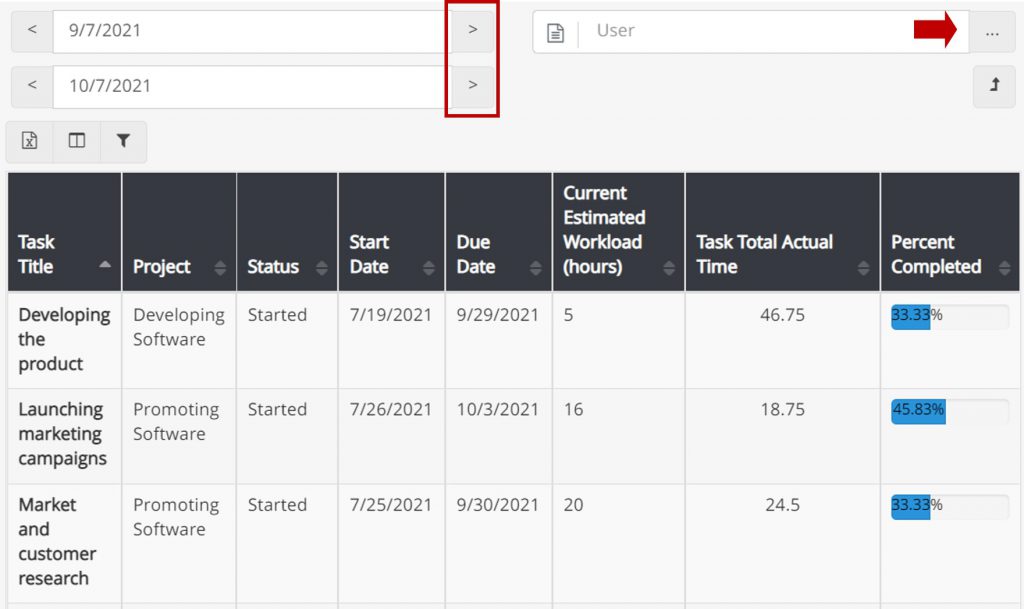
In this report, you can view the percent completed of a project’s tasks by clicking on the project title.
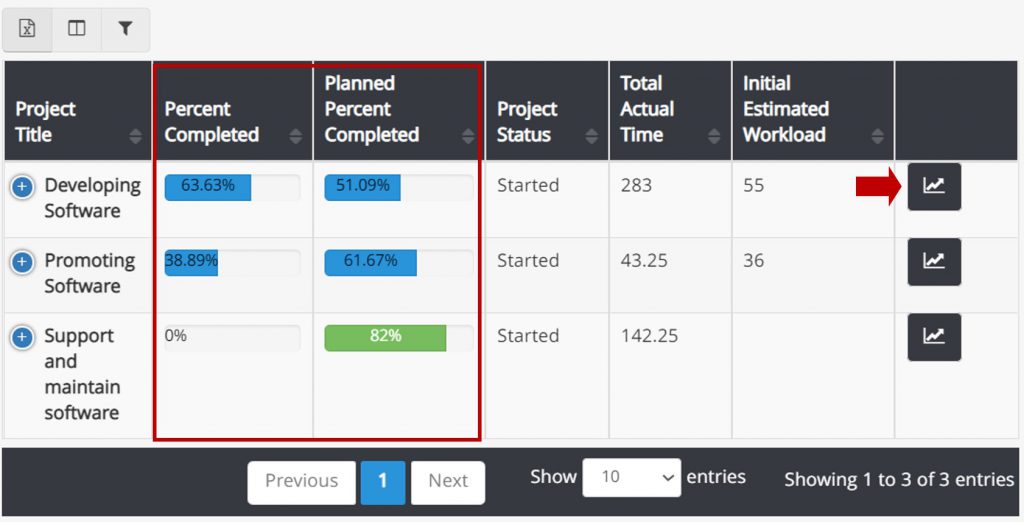
Planned Percent Completed
The Planned Percent Completed of a project will be calculated based on its tasks and their weights in the project. The weight of a task in the project is its Initial Estimated Workload.
Planned Percent Completed is calculated only for tasks that have a start and a due date.
This Percent is acquired by considering the elapsed days from the start date of a task.
Progress history chart
Use this chart by clicking on the shown icon. (above image)
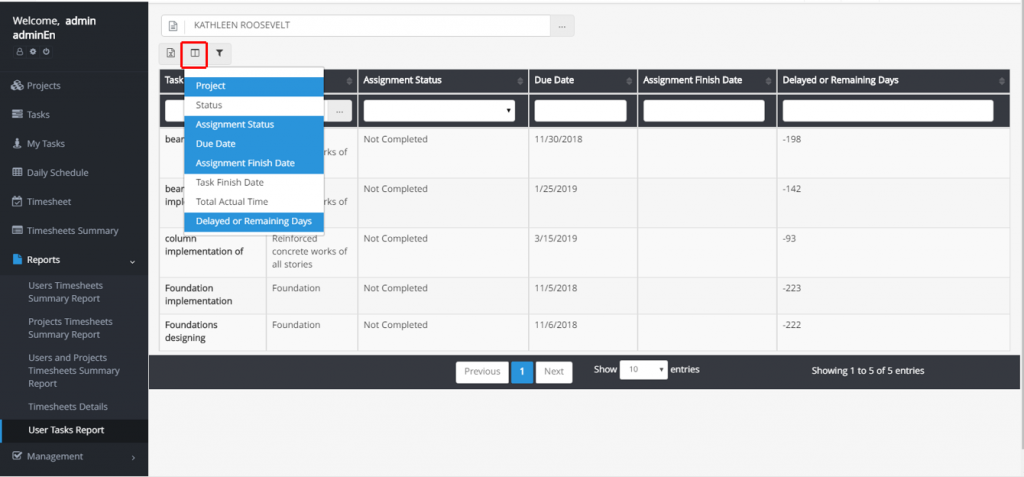
User tasks report
Choose a user from the top search bar so that you can see all the tasks which are assigned to her, the title of the related projects, the status of each task, the deadline of them, and the number of delayed days or the number of remaining days till the deadline.
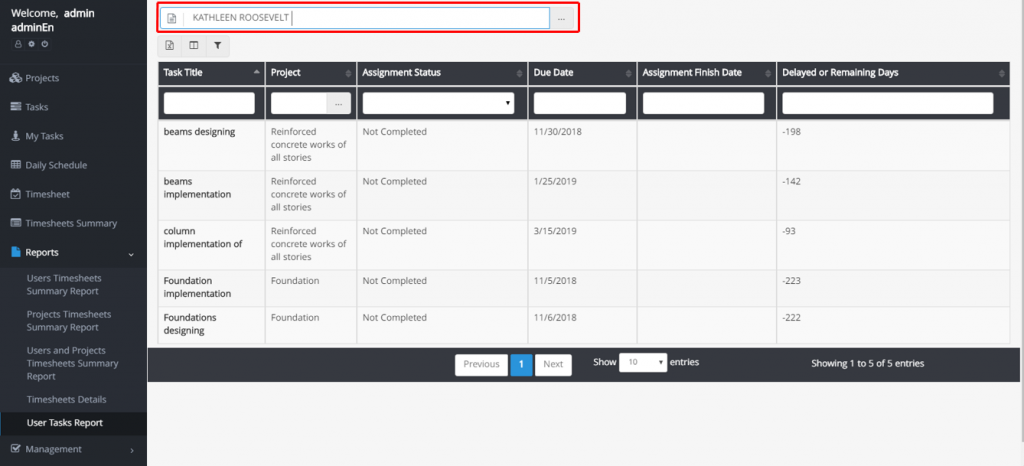
You can select the columns which provide different information about the tasks. You should know that you can export the projects using the Excel icon above the reports table.
The difference between Status and Assignment Status is that the first one shows the general status of a task which means whether all the users to whom this task was assigned, have completed it or not, and the second one shows the user status which means that whether the selected user has completed it or not. Therefore the task finish date and assignment finish date show the date of completion of each one, respectively.
Past Due Tasks Report
This report shows the tasks whose due dates are in one month before the current day. You can change the period. You can also select the username from the field shown in the image to view the overdue tasks of a particular user.
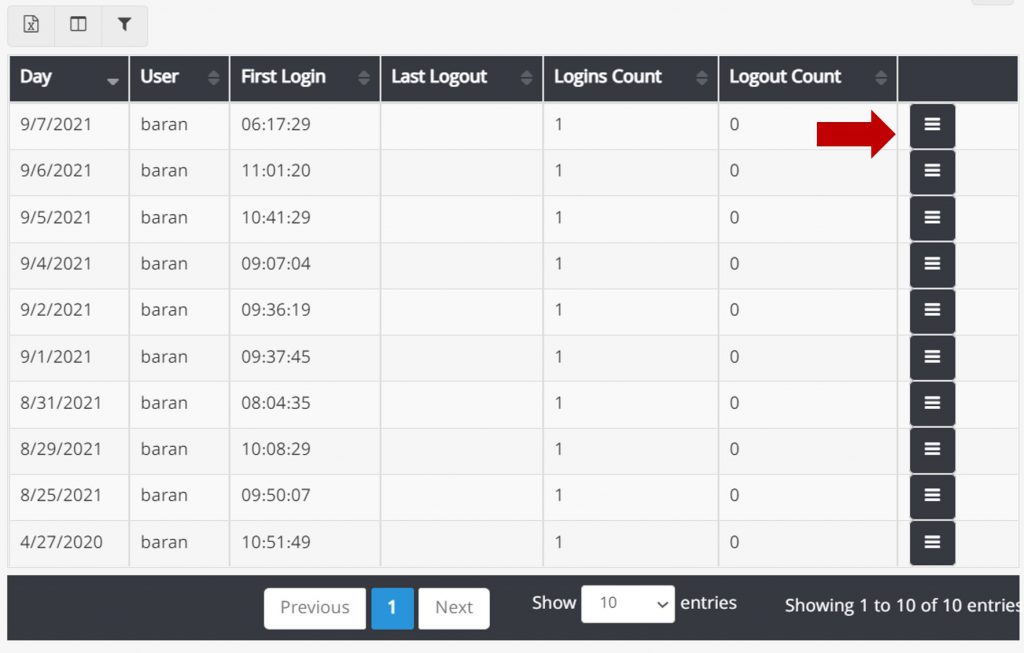
User Logins Report
You can see the first login and the last logout of the users and the number of logins and logouts on different days. You can even see the type of logins (web, mobile) and the related IP address by clicking on the shown button.
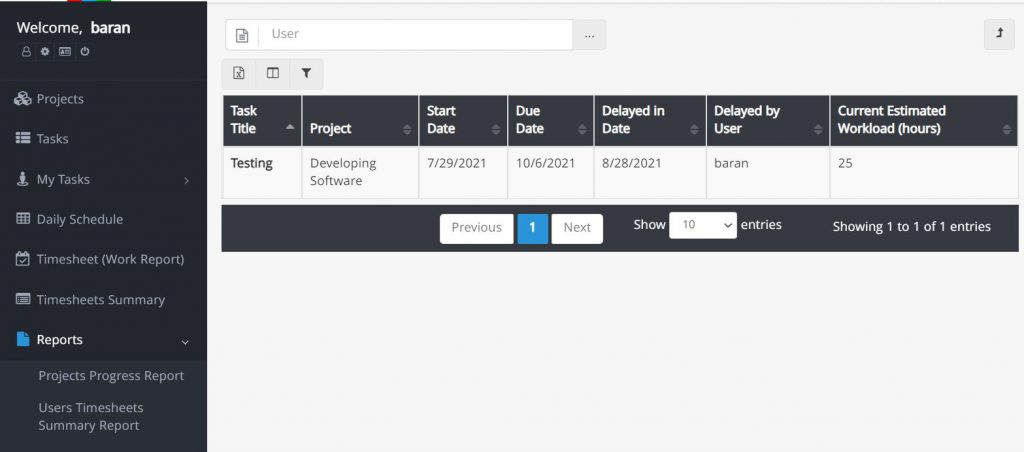
Delayed Tasks Report
A delayed (Suspended) task is a task that has been delayed by at least one member of the task team.
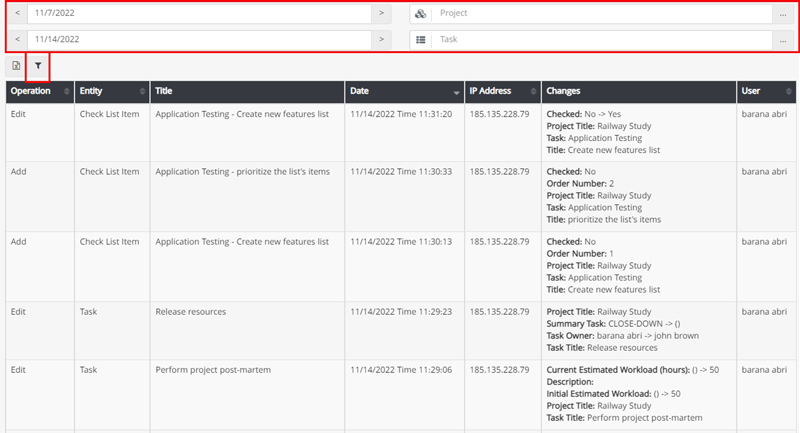
Audit Log Report
Any changes in projects and tasks are recorded and maintained in this report. People will see the details of this report according to the different permissions they have. These details include adding tasks and projects, applying any edits to tasks and projects, adding files, adding and editing comments, adding and editing checklists, etc.
The great thing about this report is that you can filter it on different information such as operation type and user. You can also see the changes on a specific project or task in a specific time range.
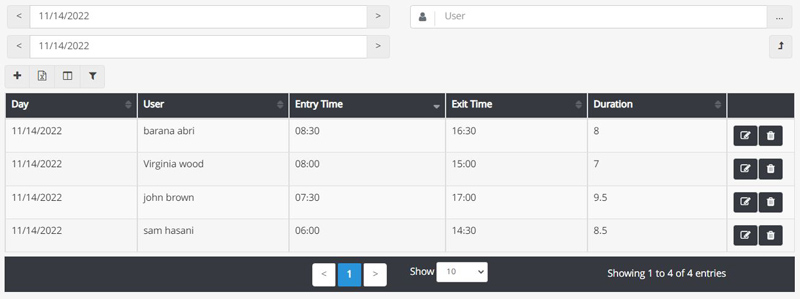
Entry/Exit Report
With the TaskBrowse Time and Attendance plugin, there is no need to prepare a separate system for absence/attendance management. First, go to the settings. (Gear icon, bottom of the welcome area) In this section, click on the Entry/Exit Settings. After applying the necessary settings, your employees can register their entry and exit, and you will receive the report in this section.
- If you do not have special permission, You only see a log of your entry and exit.
- If you have permission to manage users, you can see the log of entry and exit of all users. Using the filter option, you can view the report of a specific user.
- If you have permission to manage users and Manage Entry/Exit, you can view the log of entry and exit of all users and even delete, edit, or add data to them.
- If you have permission to manage Entry/Exit, you can manage your entry and exit in this report. (delete, edit, and add)
Project Costs Report
This report shows the wage and estimated costs of the project tasks separately. The estimated cost of a task is calculated from the estimated time of the task and the hourly cost of the users assigned to that task. The wage cost of the task is calculated from the time recorded in the timesheet and the cost per hour of the task team members. You can set the hourly cost of users in the user management section.
you can also add other costs to project tasks, providing a more accurate cost report.
To add other costs to a task, click on the “i” icon and enter the relevant information in the “Other costs” tab.
Users delay report
This report displays each user’s delay indicator and Reporting Delay Indicator, serving as a powerful tool for identifying weaknesses and enhancing team efficiency.
Calculation of User Delay Indicator:
Delay Indicator = Total Days of Delay / Total Tasks Due Within the Time Period
Reporting Delay Indicator
Measures the difference between the actual completion date and the date the user reported the task as completed. This helps you understand how timely each user is in updating task statuses
By clicking on a user’s name, you can view detailed task information, including delays, actual time spent, and other relevant data. This allows you to take necessary actions to improve their time management.
To generate this report, enter your desired time period. The report will list users along with their delay indicators for the selected period. Please note that this report, like others, displays information based on your access level.
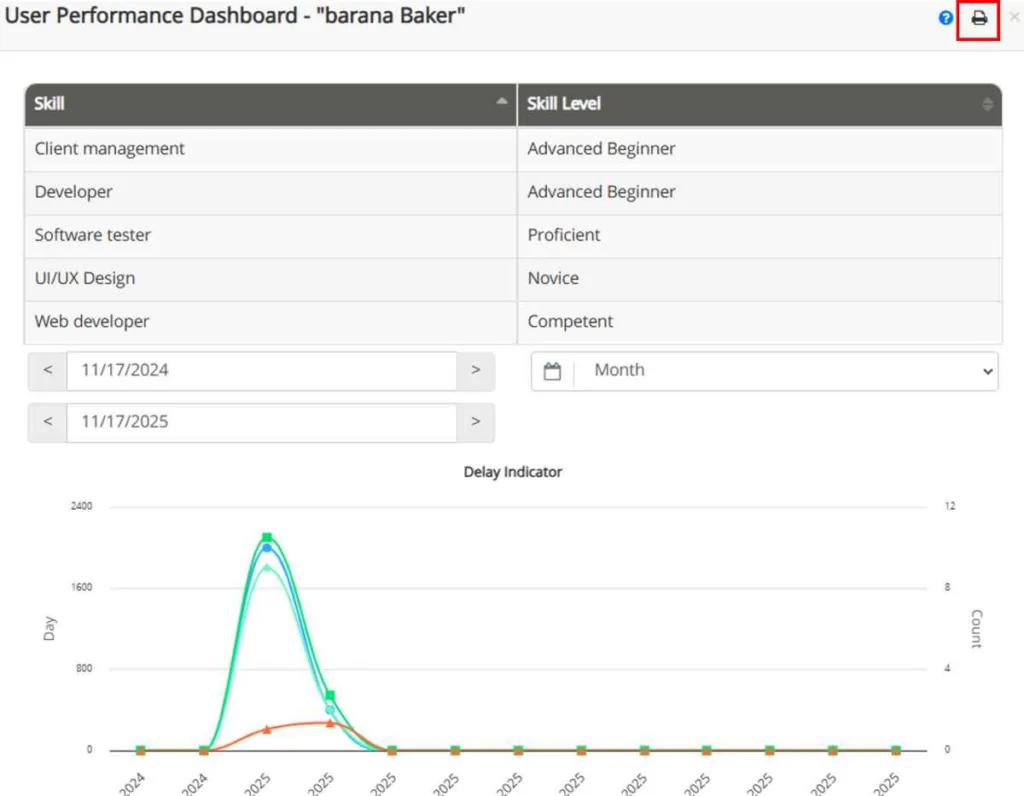
User Performance Dashboard
This report allows you to view each user’s delay indicator and Reporting Delay Indicator, across different time periods and precisely compare actual time spent with planned time.
How to view the User Performance Dashboard:
• Go to User Performance & Delays Report, then click the User Performance Dashboard icon next to the user’s name.
• You can also access each user’s Performance Dashboard through User Management or the User Profile.
- At the top of the report, the user’s skills and expertise level are displayed.
- In the next section, you can track changes in the delay indicator over time by selecting your desired time period and preferred breakdown.
- The next chart in this section compares the actual time with the planned time for the individual within the same time period.
- The following two charts display the share of projects and activities in the actual time the individual has spent within the organization.
Printing the Performance Dashboard
In the latest update, you can print the user’s Performance Dashboard directly—either as a physical copy or as a PDF for documentation or performance review meetings.
Simply click the print icon .
Other Costs Report
As you know, in TaskBrowse, you can set the hourly rate for individuals so that by logging timesheets, the wage cost of tasks—and consequently, the cost of projects—can be calculated. To view these costs, you can go to the Project Costs report. TaskBrowse also allows you to add additional costs to tasks, such as the cost of materials used. With permission to manage and view costs, you can add various expenses to any task. To view additional project and task costs, there is a report titled “Other Costs report,” available under the Reports section.
Portfolios/Customers Progress Report
The names of the customers or portfolios defined in the system’s basic definitions, which have been assigned as higher-level entities for projects or contracts, are displayed in this report along with their start and end dates and progress percentages.
Programs/Contracts Progress Report
The names of the contracts or programs defined in the system’s basic settings, which have been assigned as higher-level entities for projects, are displayed in this report along with their start and end dates and progress percentages. By clicking on the name of a contract or program, you will be directed to a page where the names of its sub-projects and their progress percentages are shown. Each of these projects contributes to the overall progress of the contract based on the project weight field specified during project editing.
Projects Costs Report
In the projects costs report, you can select your desired projects and review their expenses and allocated budgets. The percentage of the budget used is also displayed. For more details, click on each project to view a breakdown of its costs.
Task Comments Report
As you know, in the “Comments” tab, you can share your thoughts about a task with the people collaborating with you on that task. You can export the registered comments for each task to an Excel file or view them all at once through the Comments Report.
2) Time Reports
Users Timesheet Summary Report
In this section, the scheduled and real work time of each employee is displayed within a specific period of time. At the top of the page, you can change the time period. As shown in the screenshot below, you can view the reports of approved, in progress, returned, and rejected timesheets or you can view all the reports. (If you do not have the “View All the Reports” permission, only your own reports will be displayed.)
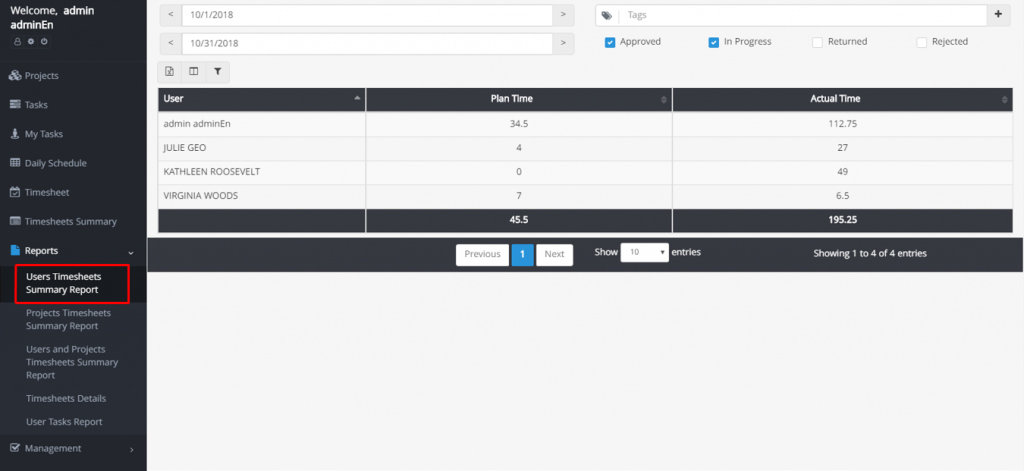
You can view even more details. For example, by clicking on any username on this page, you can see how much time she has spent on each project.
Projects Timesheets Summary Report
In this section, you can see how much time has been spent on each project in the company.
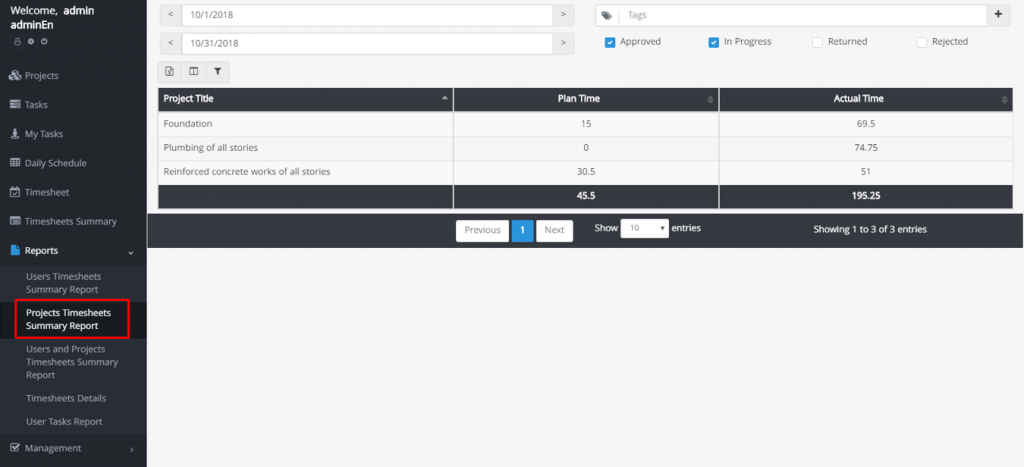
By clicking on each project, you can see how much time each user has worked on it.
By clicking on the name of a project again, you can view more details. Such as the list of the tasks which are related to it, and the users who have worked on each task.
Users and Projects Timesheet Summary Reports
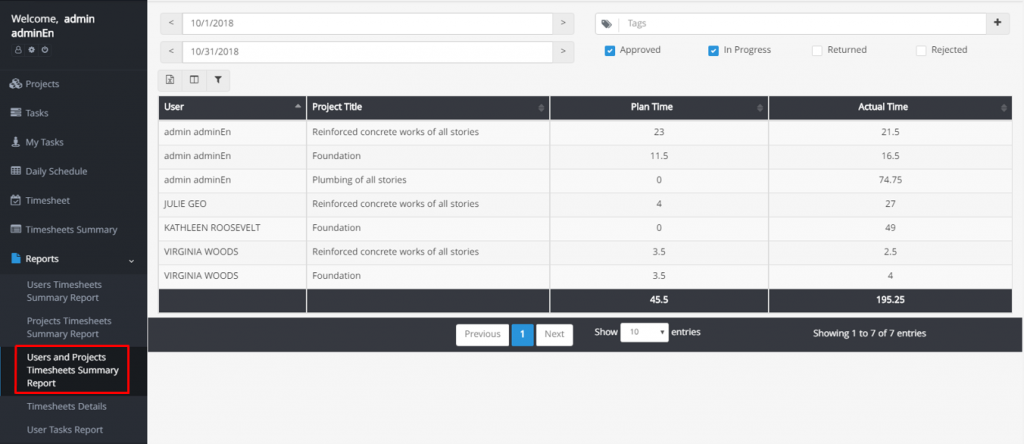
This section is a combination of two previous reports.
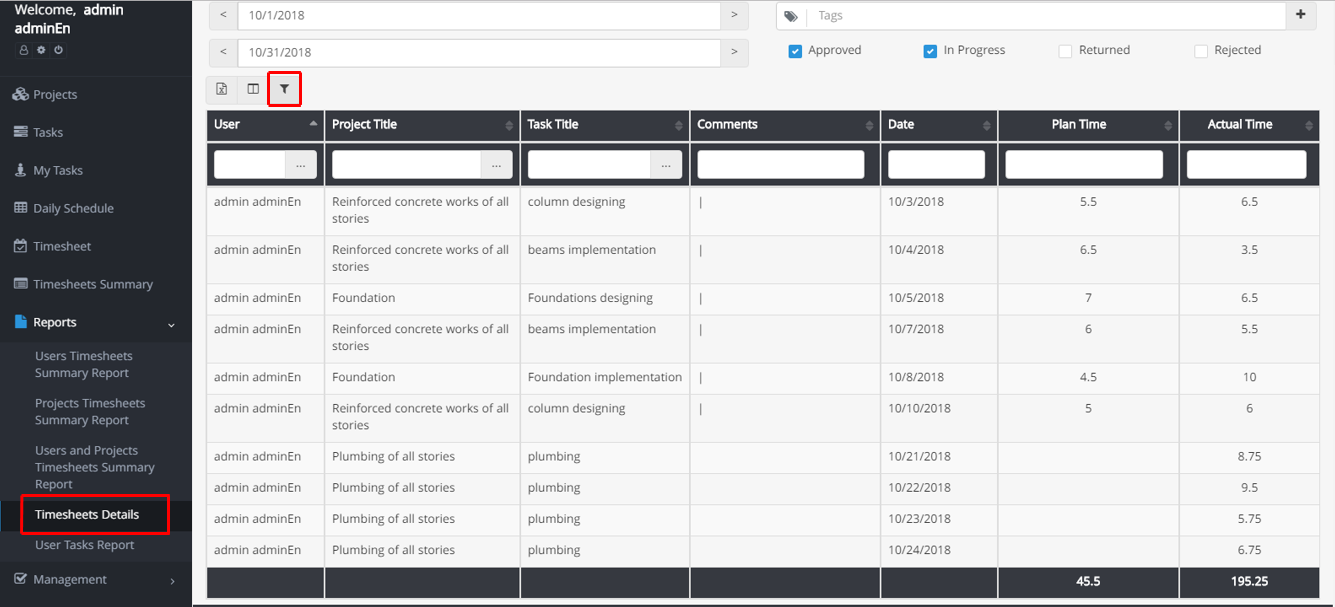
Timesheets Details
All the details, such as the tasks, the projects, the date, scheduled time, and real-time are shown in this section based on the users. If you have the “View all the reports” permission, you can see the reports of all users. In order to view the reports of a specific user, you must use the filtering feature.
Timesheets and Attendance Time Report
By filtering, you can select different users and access various data from their timesheets. Data such as status, scheduled and real-time recorded in a timesheet of a day, as well as the attendance time of that day for a special user.
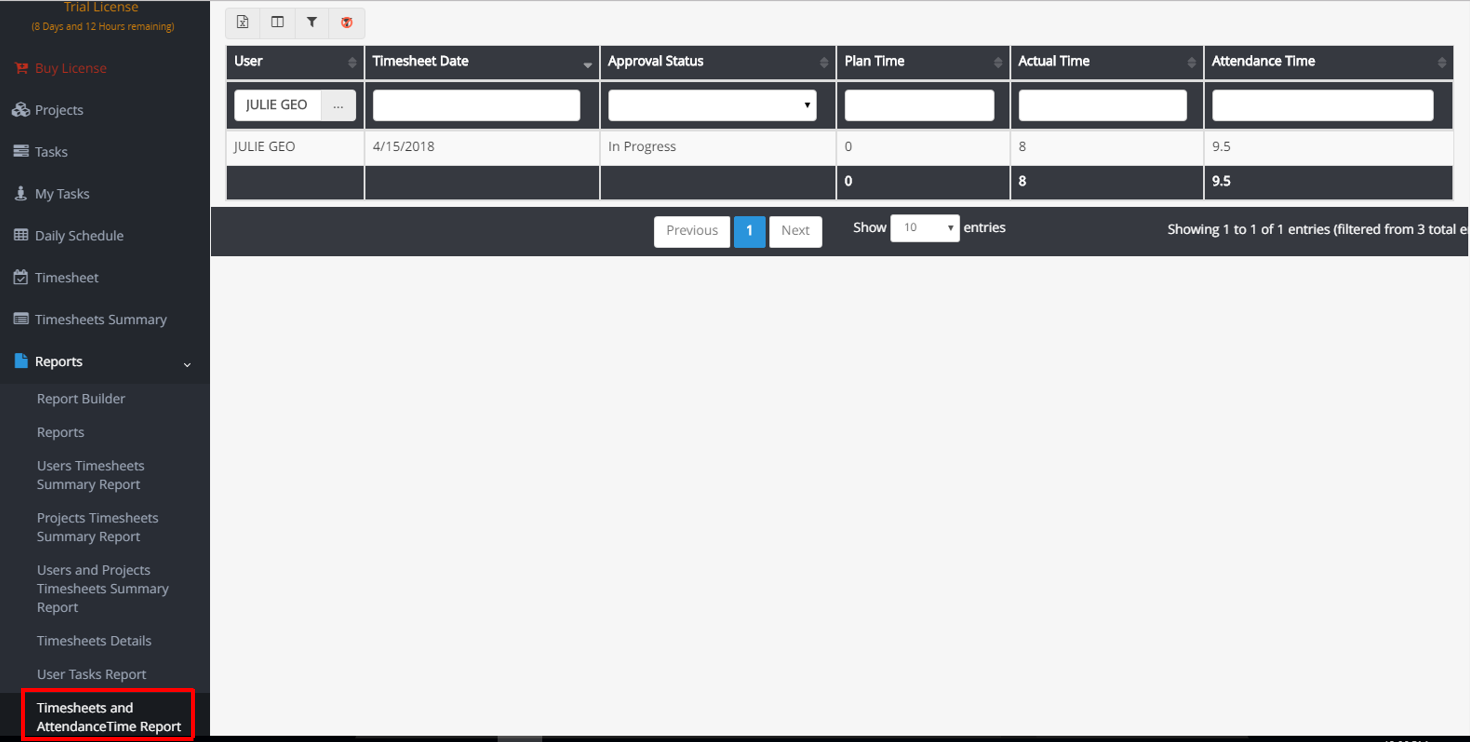
Attendance Time:
If you have the attendance time of users, TaskBrowse lets you import the attendance time in the form of an Excel file. This column shows the data of that file. For importing this file, refer to the Import Attendance Time of users in the Management section.
Calculated Presence Time:
TaskBrowse calculates the time of a user’s presence in the company according to the recorded Entry/Exit.
More information: Time and Attendance plugin
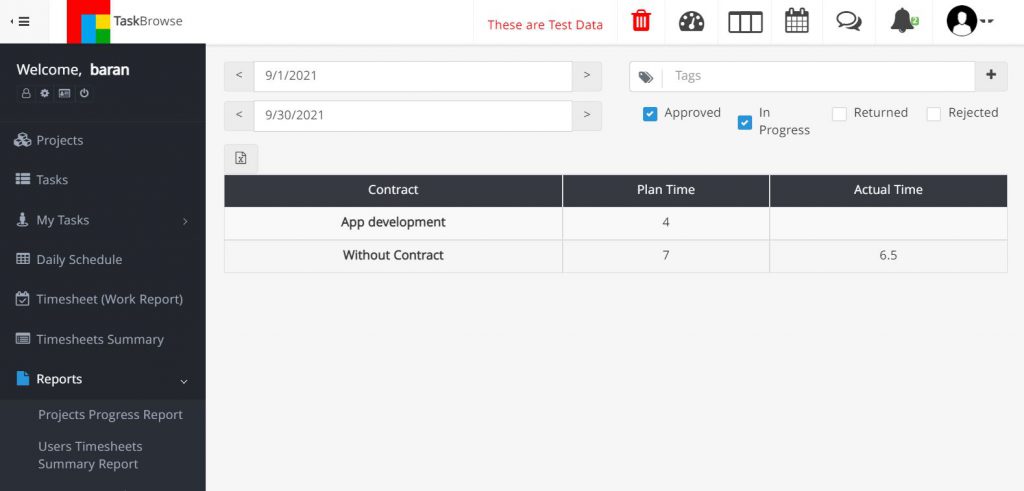
Programs/Contracts Timesheets Summary Report
This report shows you the time spent on each contract. Click on the name of each contract to display the time spent on its various projects.
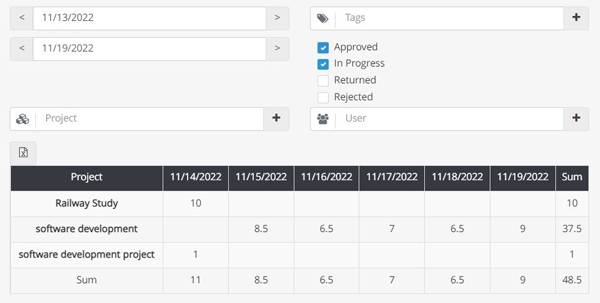
Project Daily Planning Report
This report shows you the hours scheduled by the project team for the projects. In this way, you can filter users and evaluate their workload in this report before assigning them a new task, so assigning tasks to team members is more reasonable. People who do not have special access can see their schedule in this report.
3) Tailor-made Reports
As you know, you can build new reports by using Analyzer, and this category includes them.